Expert Perspectives: How to Apply the 80/20 Rule to Your Revenue Strategy
Did you ever think that it would cost over $100 to fill your gas tank? Gas prices along with inflation, the ongoing global pandemic, and the Great Resignation are forcing businesses to think differently. To stay competitive despite these economic and social challenges, enterprises must maintain agility and the ability to move at lightning speed, the way that a much smaller company or startup can.
An effective way to achieve that agility today is with an 80/20 revenue roadmap.
Inspired by the 80/20 rule so beloved by consultants (and for good reason), this roadmap is a simple, straightforward structure to identify your business’s strengths, opportunity areas, success levers, and potential revenue streams so you can position yourself for success. The strategy is focused on making dynamic adjustments to your strategies that are informed by directionally accurate data.
How to Apply the 80/20 Rule to Your Revenue Strategy
Let’s review the steps you’ll need to work through in order to create an 80/20 revenue strategy.
1. Identify your two core strengths.
First, identify what your customers would say are your two core strengths as a business. Avoid selecting strengths that are simply internal perceptions or aspirations. If needed, connect with your top customers to determine what those strengths are — ask them what they value most when it comes to your brand and product/service.
2. Plot your product or service’s aptitude against your core strengths.
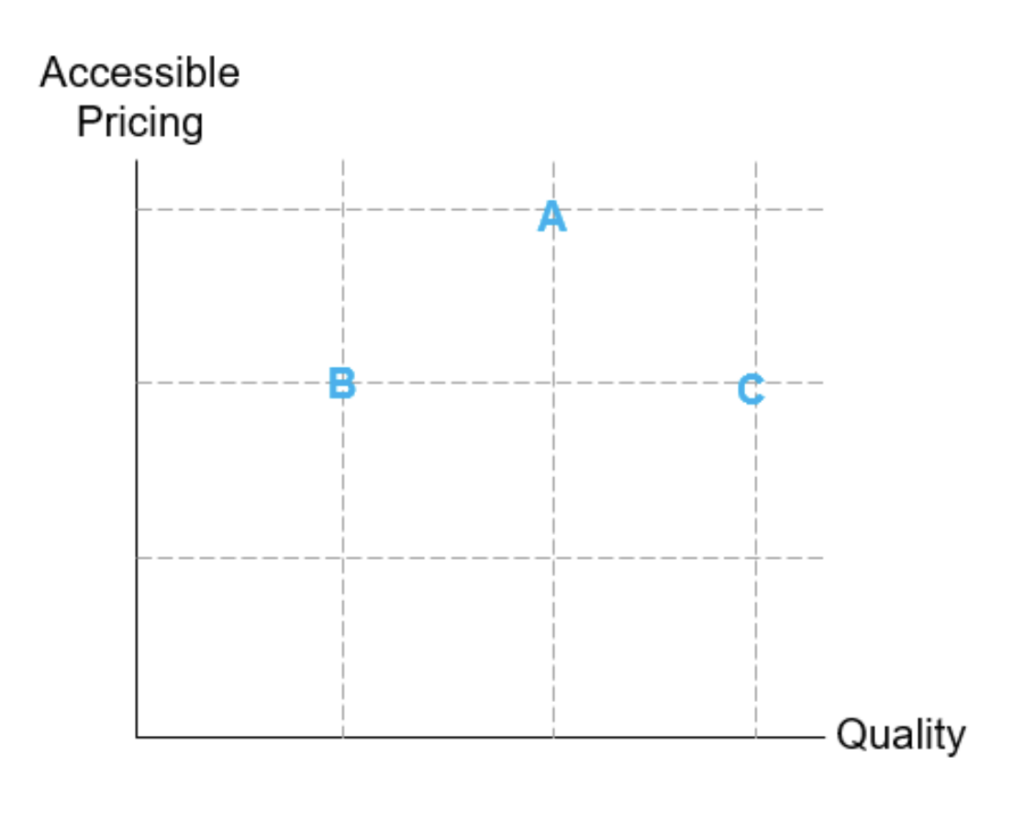
Next, create a graph to determine the aptitude of your product or service against your two core strengths. Plot your strengths along the X and Y-axes, and score each product’s strength aptitude as one (for low aptitude), two (for medium aptitude), and three (for high aptitude).
For example, you may determine that your two core strengths are quality and accessible pricing. Product A scores a three for excellent accessible pricing and a two for medium or average quality.
3. Plot the aptitude of your competition’s product or service against your core strengths.
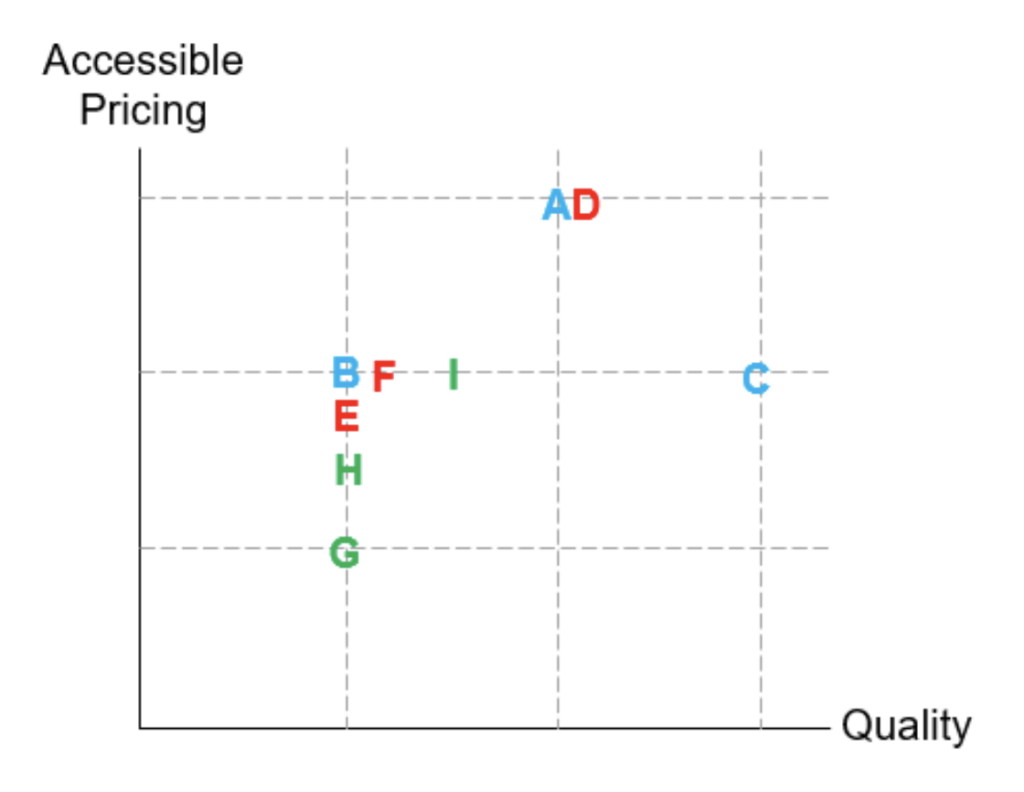
Now add your competition’s products to the chart, scoring them based on customer perception. In order to avoid boiling the ocean, choose your top five-to-ten competitors, or those that account for 80% of the market share. This may vary greatly depending upon your industry and level of monopoly or fragmentation. When in doubt, use the 80/20 rule acknowledging what companies and specific products/services are driving the majority of the market share.
In the example below, we’ve plotted products from two competitors in differentiated colors green and red.
4. Brainstorm opportunity areas.
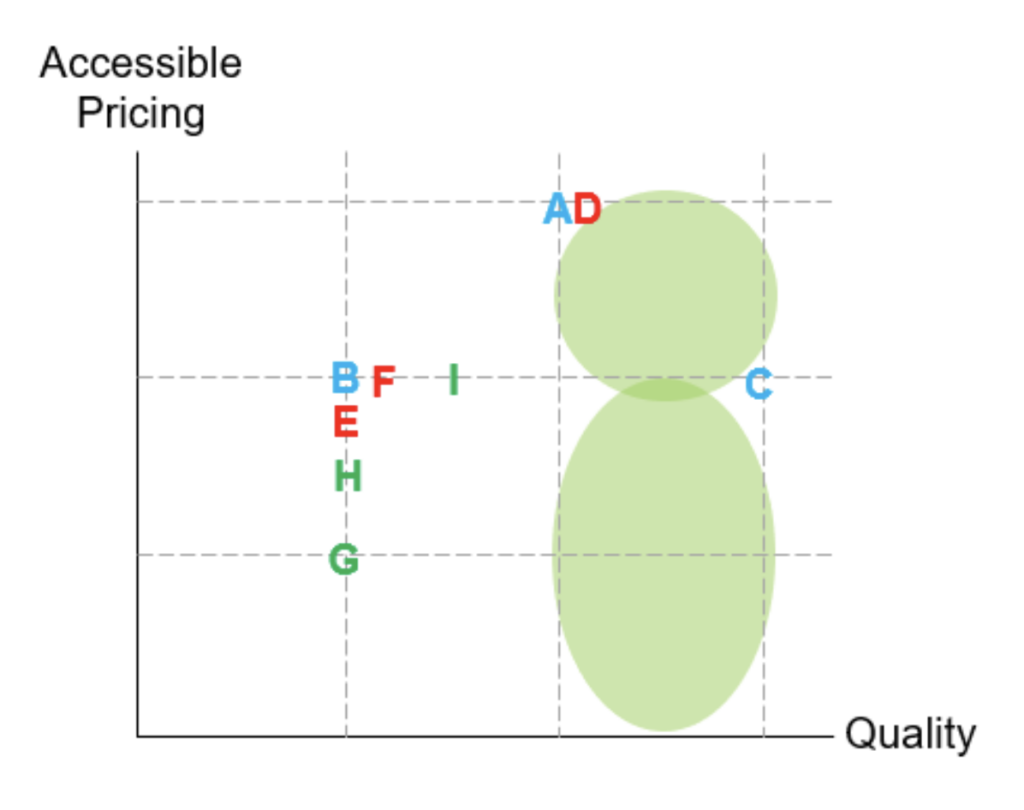
Now it’s time to look at your completed graph and make note of where you have opportunity areas. Then, begin to brainstorm how you can fill those gaps. Create a list of potential new revenue streams related to the opportunity gaps within your core strengths.
In our example below, there is a lack of higher quality products in the market at various price points, which could potentially indicate opportunity spaces for new, but similar products to existing items A and C.
5. Identify success levers.
After brainstorming potential revenue streams and ways to fill the opportunity areas within each core strength, identify two key levers that would define the success of the product or product update that you proposed during your brainstorm. The most common success lever is revenue (or profitability, depending on the margins of your industry). Other potential success levers include:
- Time to implement
- Ease of implementation (i.e. low hanging fruit)
- Fixed cost
- Profitability
- Absolute revenue
- Etc.
For example, if your company has limited human capital due to layoffs or attrition, perhaps ease of implementation is the way to go. Or maybe your industry has very high product development costs (such as pharmaceuticals or fashion), and therefore fixed cost is a key deciding factor. Make sure that the two levers are supporting your business needs right now based upon both macro and industry trends.
6. Plot your new revenue stream ideas.
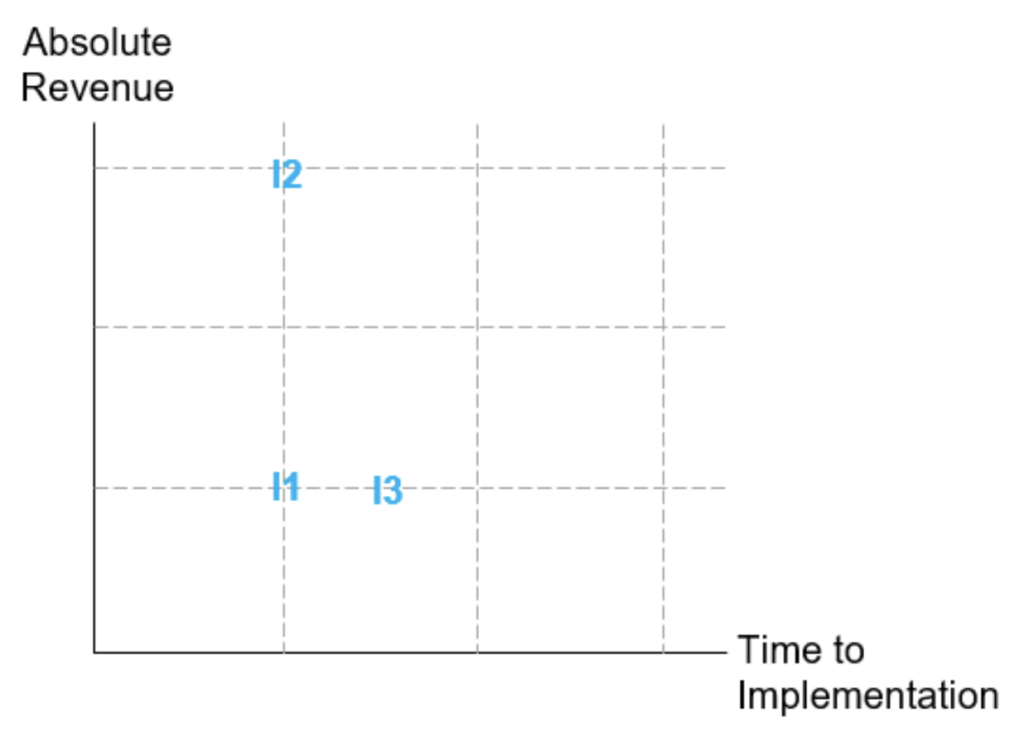
Plot your new revenue stream ideas from your brainstorm using the two chosen success levers on the X and Y-axes.
For example, your two success levers may be absolute revenue and time to implement. Idea one (noted as “I1” on the below chart) scores a one for absolute revenue, and a one for time to implement. In terms of these success levers, the products and/or services with the greatest potential for success are in the quadrant where the lowest time to implement scores meet the highest absolute revenue scores. This means idea two (noted as “I2”) in our example below has the greatest potential.
7. Create and implement a work plan.
Force rank the prioritization of the new products and/or services based on the graph you created in the previous step. Take an hour or two to create a work plan with clear milestones and owners to make the top-ranking idea a reality.
Lastly, assemble a nimble (i.e. small) task force to move the work plan into implementation. Give talented individuals the authority and accountability to move the process forward with limited approvals to avoid bottlenecks.
About the Author
Melanie Espeland is a Consultant, Executive Coach, and Founder of Espeland Enterprises and Espeland Consulting. She’s been featured in Forbes, NBC, ABC, FOX, CBS, Business Insider, and more.
Melanie can be reached at hello@espelandenterprises.com.